

SOL 1h review: three cents short of a signal and a breakout that reversed
This review covers two levels on the SOLUSDT (Bybit) 1-hour chart for October 18, 2026. There is no forecast or advice here: only what already happened on the chart and which messages Level Alert would have sent. All times are UTC.
The levels
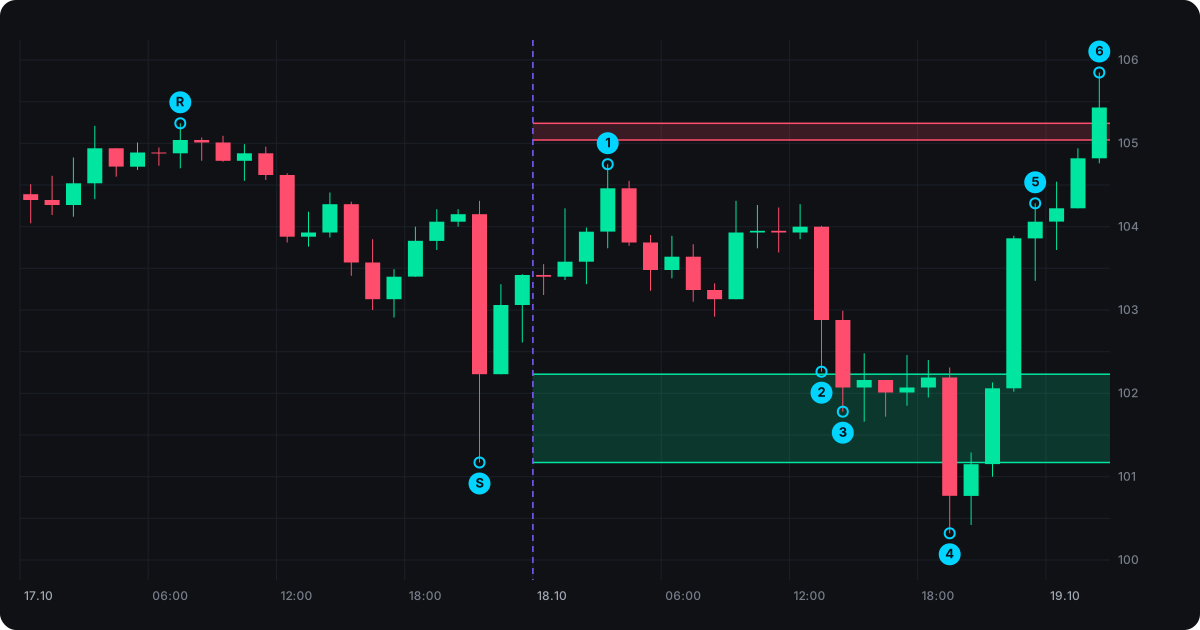
The watch was "added" on October 18 at 00:00, with price at 103.40 — between the levels.
- Resistance (R) — the October 17, 07:00 candle: High 105.24, Close 105.04. The high of October 17.
- Support (S) — the October 17, 21:00 candle: Low 101.17, Close 102.23. A sharp drop on the evening of October 17, bought back within two hours.
Zones in each level mode:
| Average | By close | By wick | |
|---|---|---|---|
| Resistance | 105.04 – 105.24 | 105.04 | 105.24 |
| Support | 101.17 – 102.23 | 102.23 | 101.17 |
The support zone in "Average" mode is $1.06 wide, about 1% of the price.
What happened next
- 03:00 — approach to resistance. The hourly high was 104.75: 29 cents short of the zone's lower edge (105.04). No signal.
- 13:00 — drop toward support. Within an hour price fell from 104 to 102.26 — 3 cents above the zone's upper edge (102.23). No signal.
- 14:00 — inside the zone. The hourly low was 101.78, and the candle closed at 102.07 — inside the "Average" zone but below the "By close" line. For the next five hours (until 19:00) price stayed in the zone: lows of 101.66–101.95, the 101.17 wick untouched.
- 19:00 — below the wick. Price fell to 100.32 — 85 cents (0.8%) below the source candle's wick. The candle closed at 100.77, below the whole zone. The 20:00 candle closed at 101.15 — 2 cents below the wick.
- 21:00–23:00 — the return. The 21:00 candle closed inside the zone (102.06), the 22:00 one already above it (103.86), and by 23:00 price reached 104.28 — 3.9% above the low.
- October 19, 02:00 — above resistance. Price reached 105.85 — above the whole resistance zone. But by then the watch was already gone.
Which messages would have arrived
A watch is removed after its first signal — so each mode gets one message.
| Level mode | Instantly on touch | On candle close (1h) |
|---|---|---|
| Average | 18.10, 14:00 — support touch around 102.23 | 18.10, 15:00 — touch (close 102.07 inside the zone) |
| By close | same as "Average" | 18.10, 15:00 — breakout (close below 102.23) |
| By wick | 18.10, 19:00 — touch of 101.17 | 18.10, 20:00 — breakout (close 100.77 below 101.17) |
What the review shows
- "Almost" is not a signal. At 13:00 price was three cents short of the zone — no message. The service compares price with the zone edge exactly, with no tolerance. If you don't want to miss an approach, make the zone a bit wider or set the level manually.
- A "breakout" doesn't mean "only down from here". In "By wick" mode the breakout came at 20:00, and two hours later price was above the whole zone, by morning above resistance. The message tells you where price is now; what to do is your call.
- A narrow line fires later. "Average" and "By close" fired at 14:00–15:00, "By wick" five hours later and only on a deep spike. The narrower the zone, the fewer messages and the later they come.
- Same level, different words. The 14:00 candle closed at 102.07: for the "Average" zone that's a touch, for the "By close" line it's a breakout. The signal type depends on where the zone edges are.
- After a signal there is no watch. In one night price went through support, came back and reached resistance — but there would have been no second message: the watch was removed after the first signal. To keep tracking, add a new watch after the signal.
The review is based on 1-hour candles. The service checks every price update, so a real "Instantly on touch" signal would have arrived within the stated hour, at the moment of the touch. An "On candle close" signal arrives when the 1-hour candle closes (at the start of the next hour, UTC).
This review shows how a level played out in the past. It is not investment advice or a signal to trade.