

BTC 1h review: resistance missed by $64, support broken and reclaimed
This review covers two levels on the BTCUSDT (Bybit) hourly chart for October 12–15, 2026. There is no forecast or advice here: only what already happened on the chart and which messages Level Alert would have sent. All times are UTC.
The levels
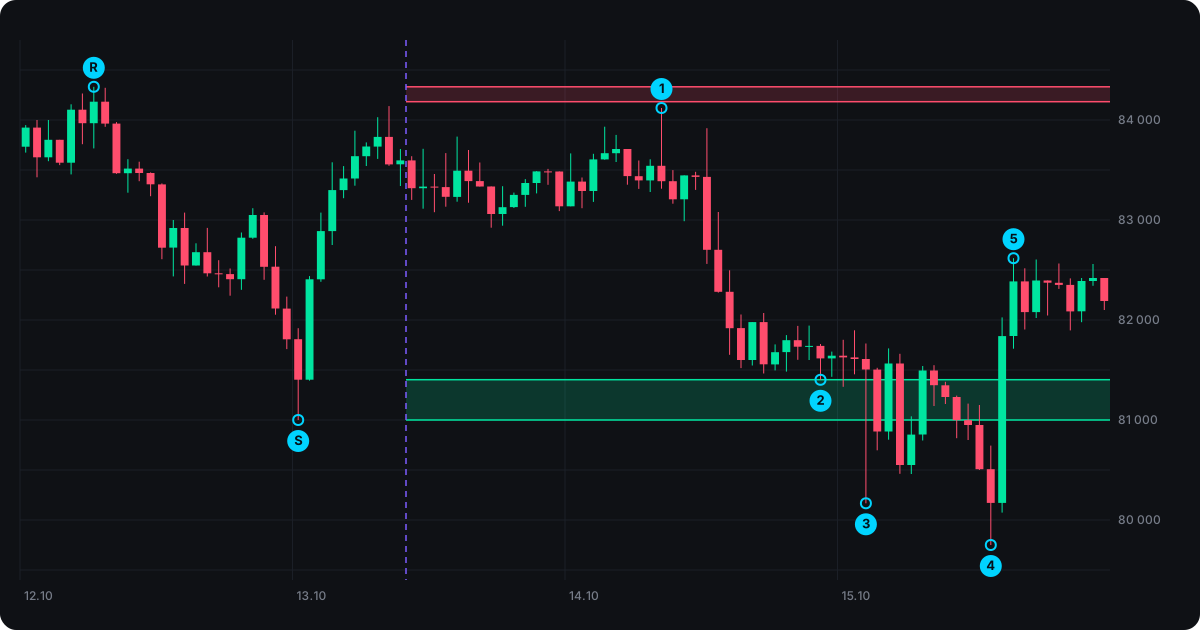
The watch was "added" on October 13 at 10:00, with price around 83,300 — halfway between the levels.
- Resistance (R) — the October 12, 06:00 candle: High 84,332.5, Close 84,183.3. The top of the October 11–12 move.
- Support (S) — the October 13, 00:00 candle: Low 81,000, Close 81,402.6. An overnight dip that was bought back quickly.
Zones in each level mode:
| Average | By close | By wick | |
|---|---|---|---|
| Resistance | 84,183.3 – 84,332.5 | 84,183.3 | 84,332.5 |
| Support | 81,000 – 81,402.6 | 81,402.6 | 81,000 |
What happened next
- October 14, 08:00 — approach to resistance. The hourly high was 84,119.6, $64 short of the lower edge of the zone. No signal in any mode; price turned down.
- October 14, 22:00 — support touched. The hourly low was 81,401.5: the "Average" zone and the "By close" line were hit by $1.10. The candle closed at 81,616, above the zone.
- October 15, 02:00 — a sharp flush. Within an hour price dropped to 80,167 — below the wick of the original candle — and closed at 81,504, back above the zone.
- October 15, 03:00–13:00 — breakdown. 7 of 11 hourly candles closed below 81,000, with a low of 79,750 at 13:00 — $1,250 (1.5%) below the lower edge of support.
- October 15, 15:00 — reclaim. Within two hours price bounced to 82,618, back above the whole support zone.
Which messages would have arrived
A watch is removed after its first signal, so each mode sends one message.
| Level mode | Instantly on touch | On candle close |
|---|---|---|
| Average | Oct 14, 22:00 — support touch near 81,402 | Oct 14, 23:00 — wick touch (close 81,616) |
| By close | same as "Average" | same as "Average" |
| By wick | Oct 15, 02:00 — touch of 81,000 during the flush | Oct 15, 03:00 — wick touch (close 81,504) |
"Average" and "By close" fired four hours earlier than "By wick" and $400 higher. Resistance did not fire in any mode.
What the review shows
- A signal means "price is at the level", not "the level held". The October 14 touch was real, yet a few hours later support was broken by 1.5% — and two hours after that price was back above the zone. The message tells you where price is now; what to do is your call.
- A wick touch is its own type for a reason. In "On candle close" mode both signals came as wick touches: price entered the zone, but the candle closed outside it. That separates a poke from a hold.
- A level is a zone, not an exact price. Resistance was missed by $64, support was hit by $1.10. The difference between modes is hundreds of dollars. Want early approaches — use "Average" or "By close": their near edge is the candle close, not the wick. Only care about the previous extreme — "By wick". And if you see the level slightly away from the candle, type it in manually.
- There is no watch after the signal. The October 15 breakdown would not have been seen: the watch was removed after the touch. To follow a breakdown, add a new watch after the signal, for example with a lower level.
The review is based on hourly candles. The service checks every price update, so a real "Instantly on touch" signal would have arrived within that hour, at the moment of the touch.
This review shows how a level played out in the past. It is not investment advice or a signal to trade.