

BTC 1h review: two "breakouts" in one day — and neither held
This review covers two levels on the BTCUSDT (Bybit) 1-hour chart for October 20, 2026. There is no forecast or advice here: only what already happened on the chart and which messages Level Alert would have sent. All times are UTC.
Levels
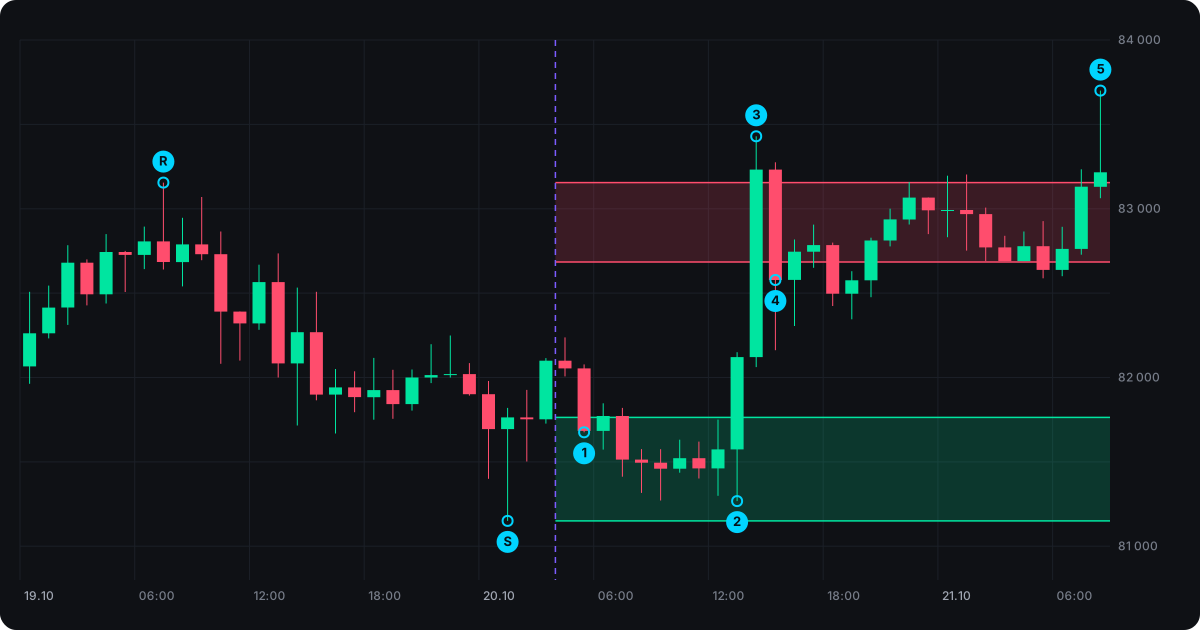
The watch was "added" on October 20 at 04:00, with price at 82,099 — between the levels, $336 above the support zone.
- Resistance (R) — the October 19 07:00 candle: High 83,155, Close 82,684.2. The high of October 19.
- Support (S) — the October 20 01:00 candle: Low 81,150, Close 81,763.4. An overnight drop that was bought back within the hour.
Zones in each level mode:
| Average | By close | By wick | |
|---|---|---|---|
| Resistance | 82,684.2 – 83,155 | 82,684.2 | 83,155 |
| Support | 81,150 – 81,763.4 | 81,763.4 | 81,150 |
What happened next
- 05:57 — support touch. Price dipped to 81,675 — into the "Average" zone and below the "By close" line. The candle closed at 81,683.4, inside the zone.
- 06:00–13:00 — eight hours at support. Almost every candle closed inside the zone; the low was 81,267.8 at 13:00. Price fell $118 short of the source candle's wick (81,150).
- 13:00–14:59 — the rally. In two hours price rose 2.7%, to 83,429.2, and went through the whole resistance zone. The 83,155 wick was crossed at 14:12, and the 14:00 candle closed at 83,232 — above the zone.
- 15:00 — the return. The candle closed at 82,578 — below the whole resistance zone, $577 under the wick. For the next 16 hours price moved inside and below the zone, but never closed above it.
- October 21, 08:00 — above again. Price reached 83,700 and closed at 83,216.2 — above the resistance zone. But by then there was no watch anymore.
Which messages would have arrived
A watch is removed after its first signal — so each mode sends one message.
| Level mode | Instantly on touch | On candle close (1h) |
|---|---|---|
| Average | 20.10, 05:57 — support touch around 81,763 | 20.10, 06:00 — touch (close 81,683.4 inside the zone) |
| By close | same as "Average" | 20.10, 06:00 — support breakout (close below 81,763.4) |
| By wick | 20.10, 14:12 — resistance touch at 83,155 | 20.10, 15:00 — resistance breakout (close 83,232 above 83,155) |
What the review shows
- A breakout is not a promise of continuation. Neither of the day's breakouts held. "By close" reported a support breakout, yet price never went below 81,267.8 and then rose 2.7%. "By wick" reported a resistance breakout — and the very next candle closed below the whole zone. A message tells you where price is now; what to do is up to you.
- A narrow line may never see its level. Price sat in the support zone for eight hours but never reached the 81,150 wick — it was $118 short. In "By wick" mode there was no support message at all, and the first signal came from the resistance at the other end of the chart.
- One level — different words. The 05:00 candle closed at 81,683.4: for the "Average" zone that is a touch, for the "By close" line it is a breakout. The signal type depends on where the zone's edges are, so choose the level mode in advance.
- No watch after the signal. On the morning of October 21 price did close above resistance — but no message would have come: all three watches had already been removed. Want to keep following? Add a new watch after the signal.
The review is built on 1-hour candles; touch minutes come from Bybit 1-minute candles. An "On candle close" signal arrives when the hourly candle closes (at the start of the next hour, UTC).
This review shows how a level played out in the past. It is not investment advice or a signal to trade.